Managing Semaphore
This page explains how to set up notifications and what settings are available in your Semaphore instance.
On Semaphore Community Edition, we use the terms server, instance, and organization interchangeably.
Overview
In order to access any non-public resources on Semaphore you must be invited to the Semaphore instance.
If you are trying out Semaphore for the first time, we suggest the Quickstart, where we show how to get started quickly.
A Semaphore instance has:
- zero or more projects
- one or more owners
- users role-based permissions
- a dedicated URL, for example,
https://semaphore.example.com
Instance settings
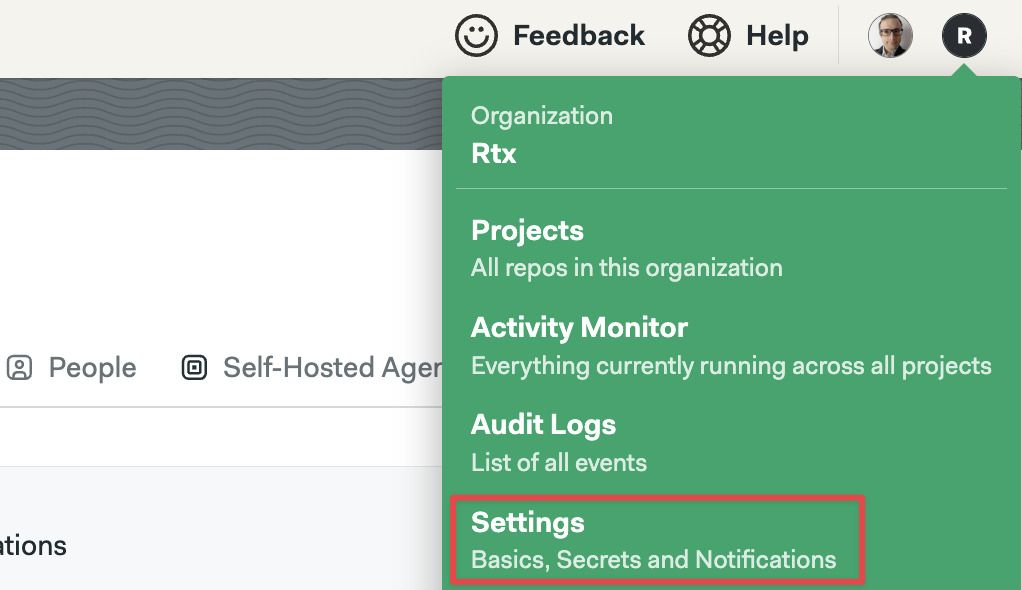
To access your settings, open the server menu and click on Settings.
General settings
This page shows the main settings for your instance. Here, you can change its name, and control how workflows run.
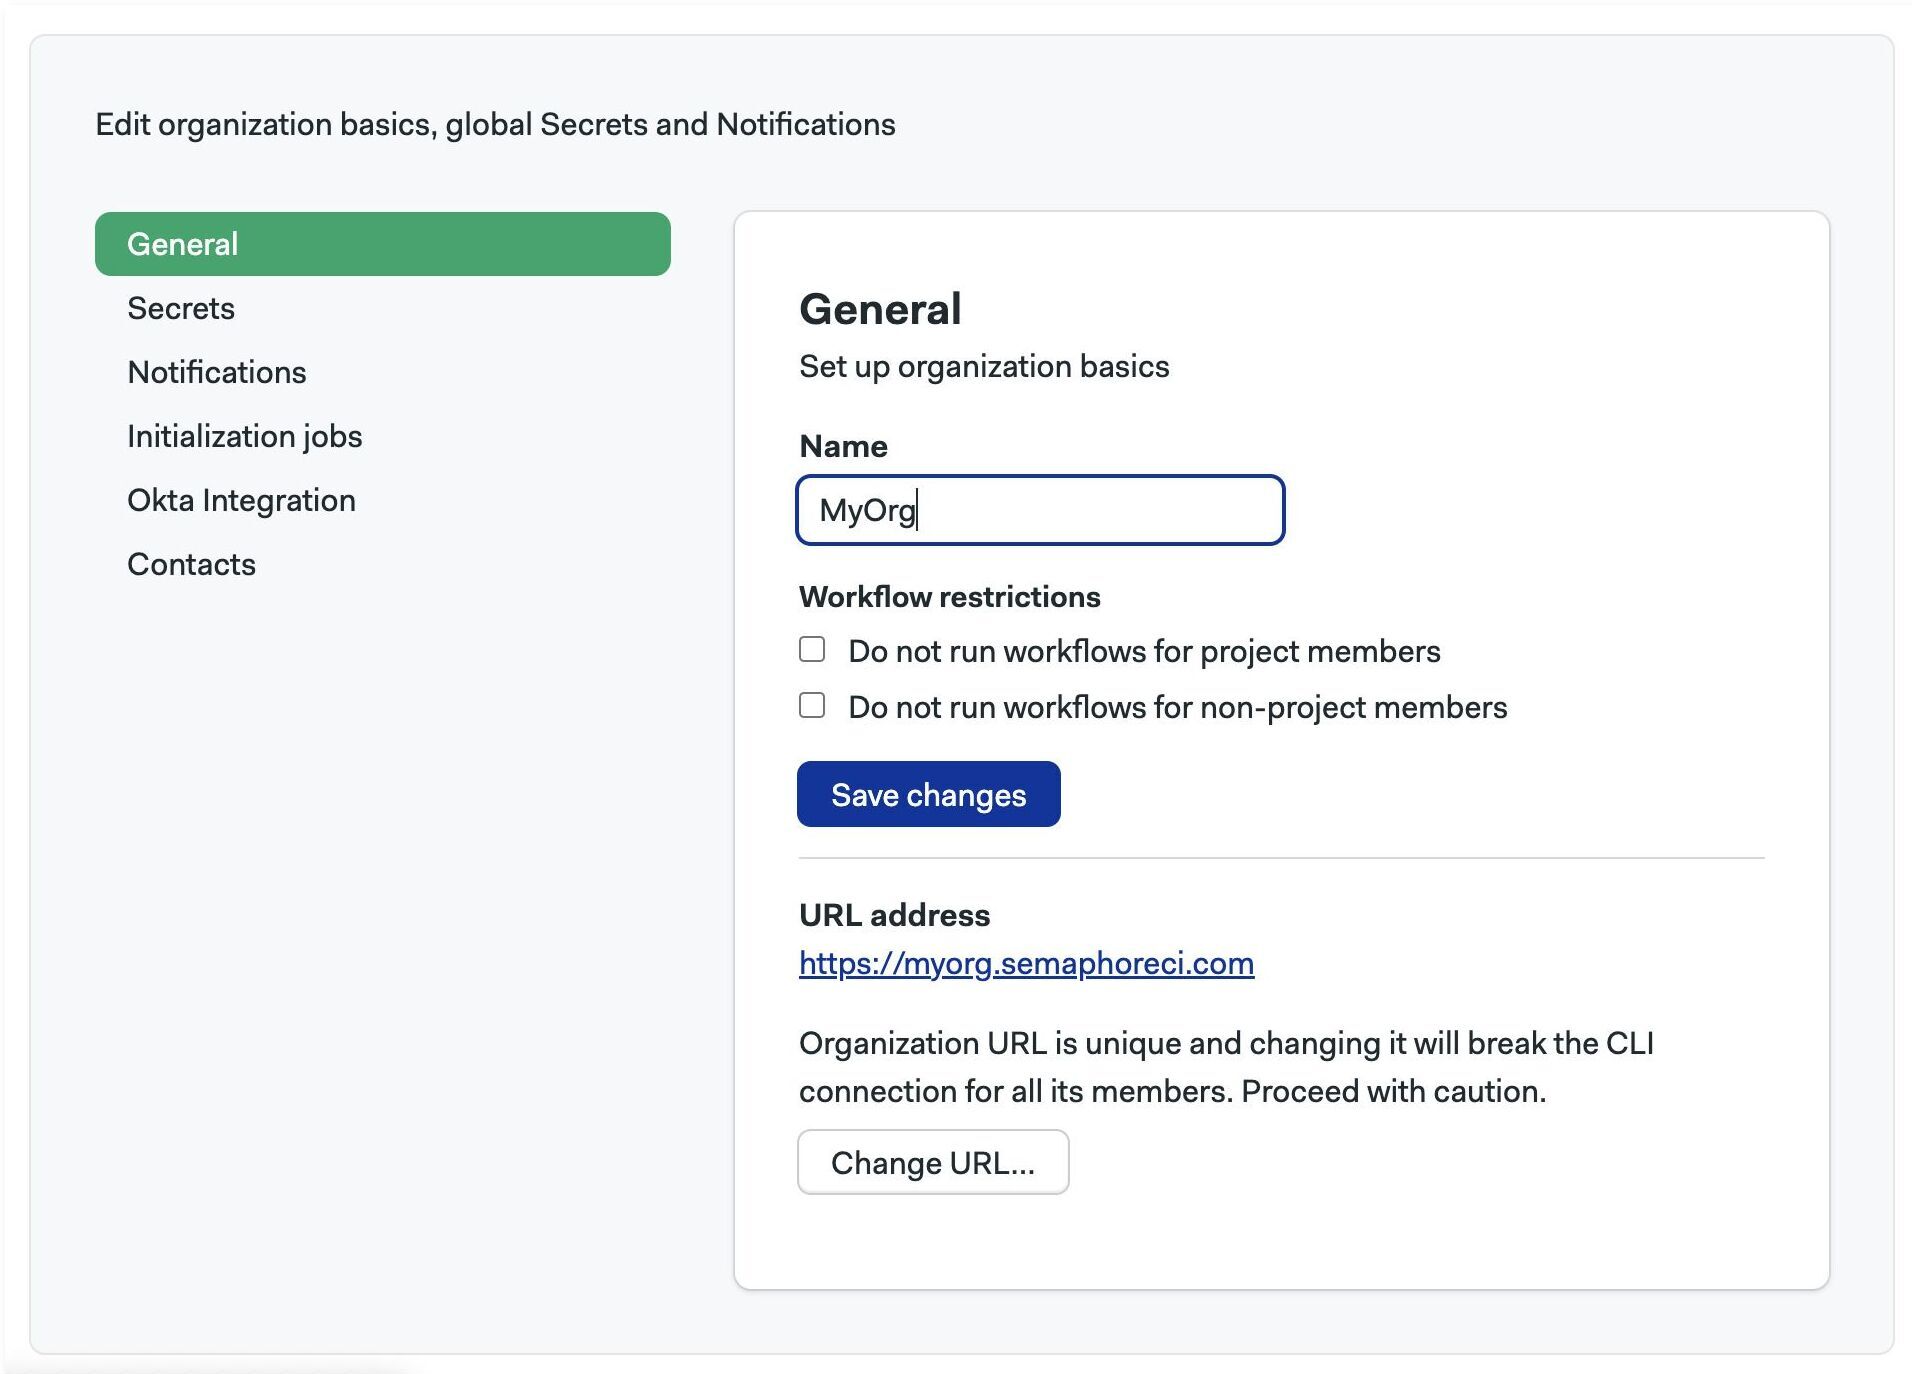
The URL of your server is the URL that leads to the Home page in your Semaphore instance. For example semaphore.example.com
Notifications
You can set up Slack and other webhook-based notifications to get your team notified whenever there project finishes running.
To learn more, see the notification documentation
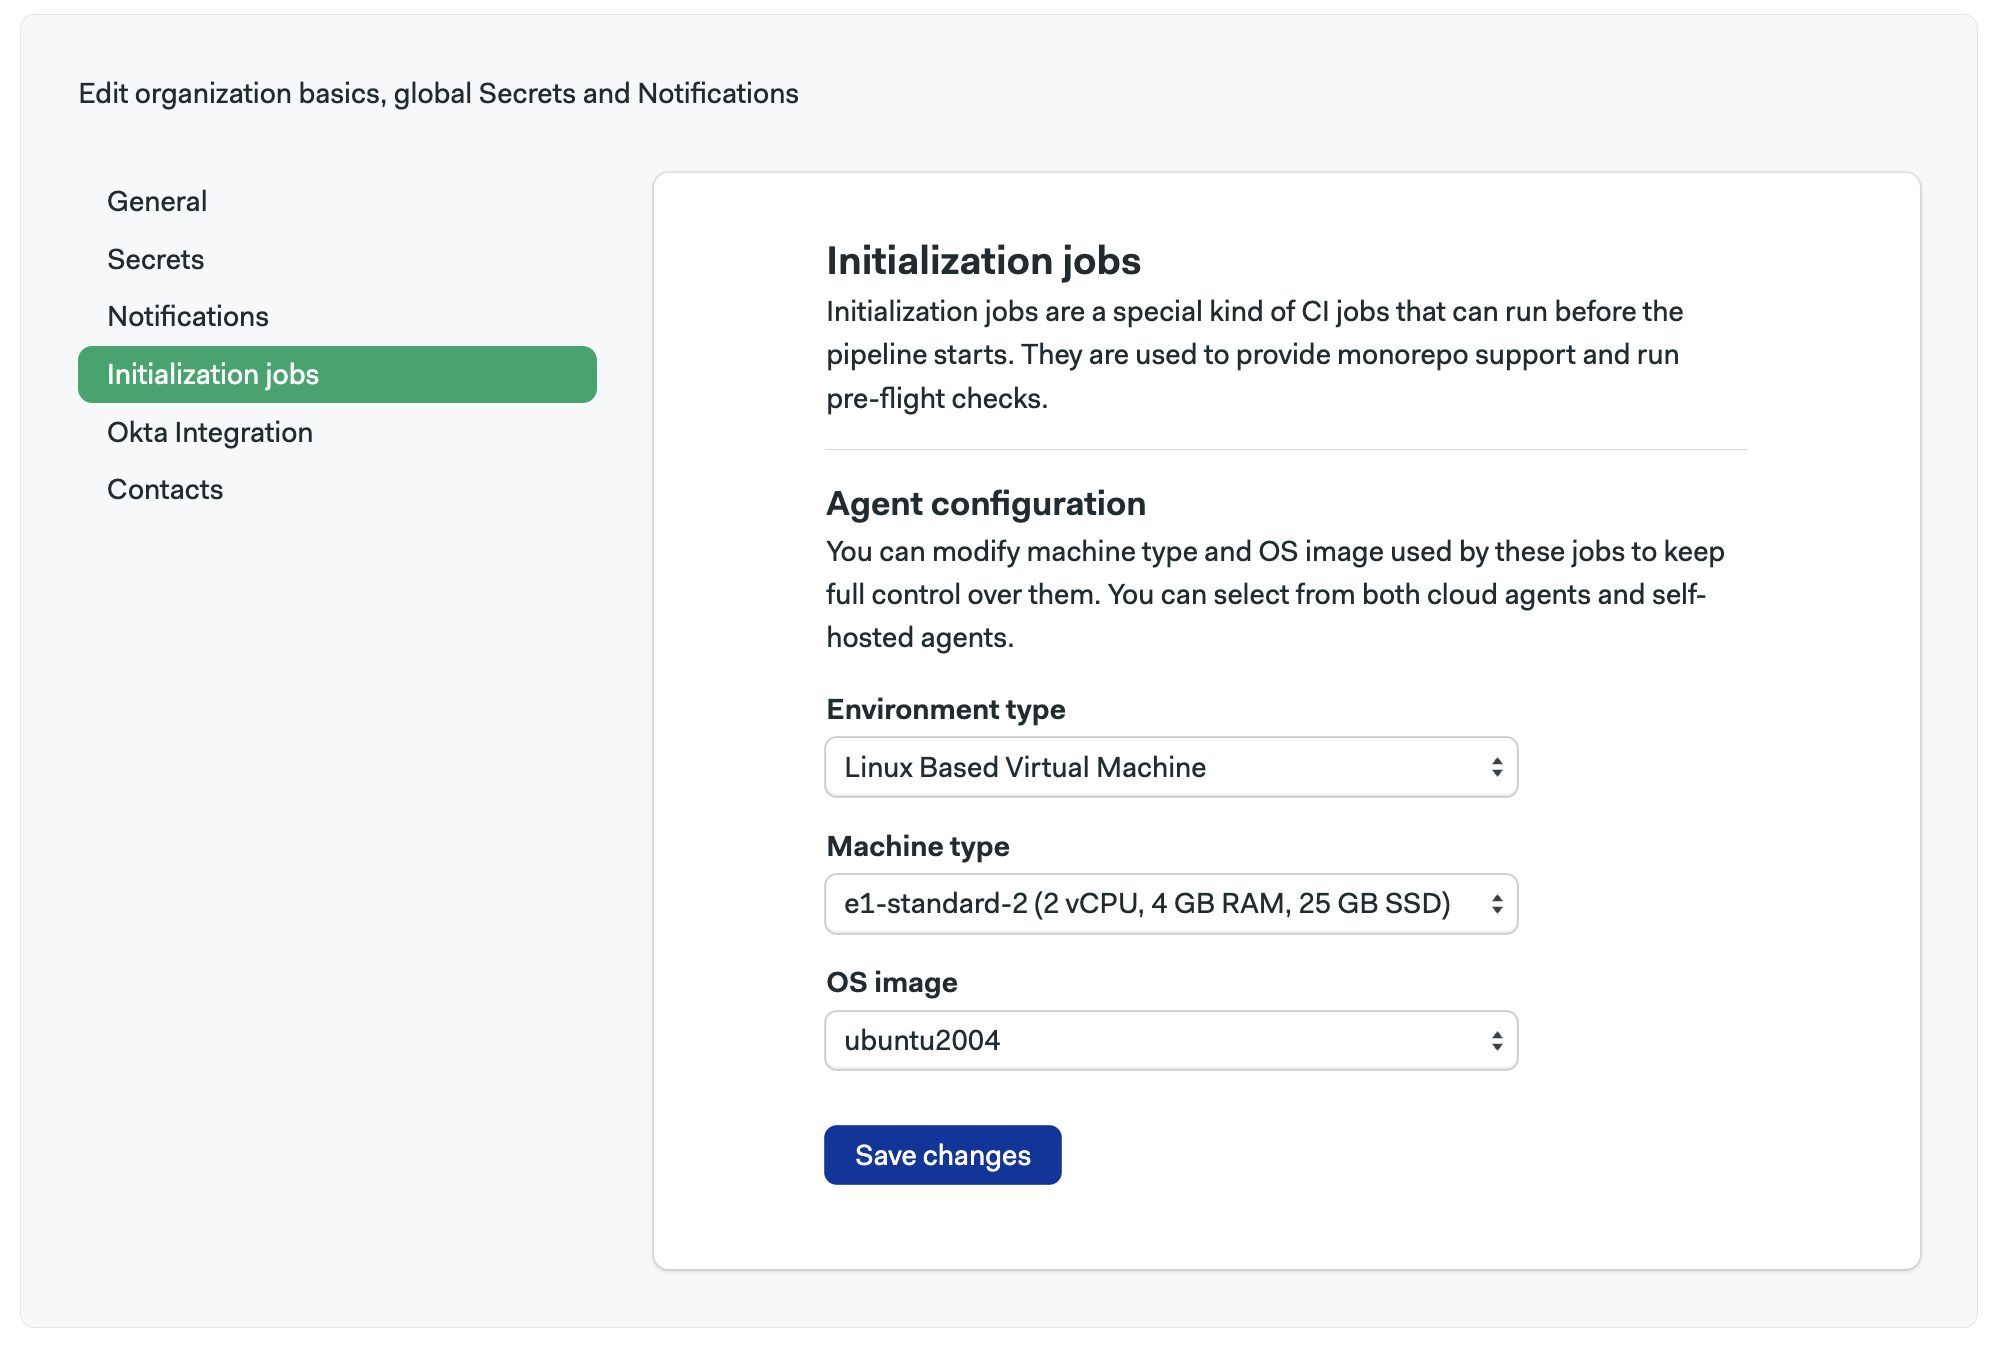
Initialization agent
Some types of pipelines require initialization job to evaluate and compile the them before the workload beings.
Semaphore tries to pick the best type of agent automatically but you change it for the whole server. This is particularly useful when you are using self-hosted agents.
To change the initialization job agent for all your projects in your Semaphore instance, follow these steps:
- Select Initialization job from the settings menu
- Select the Environment type
- Select the Machine type
- Select the OS image (if available)
- Press Save
If you experience errors during initialization, see the initialization job logs to help troubleshoot the issue.
Project queues
You can use queues to control the order in which pipelines are executed in your instance. See named queues for more information.
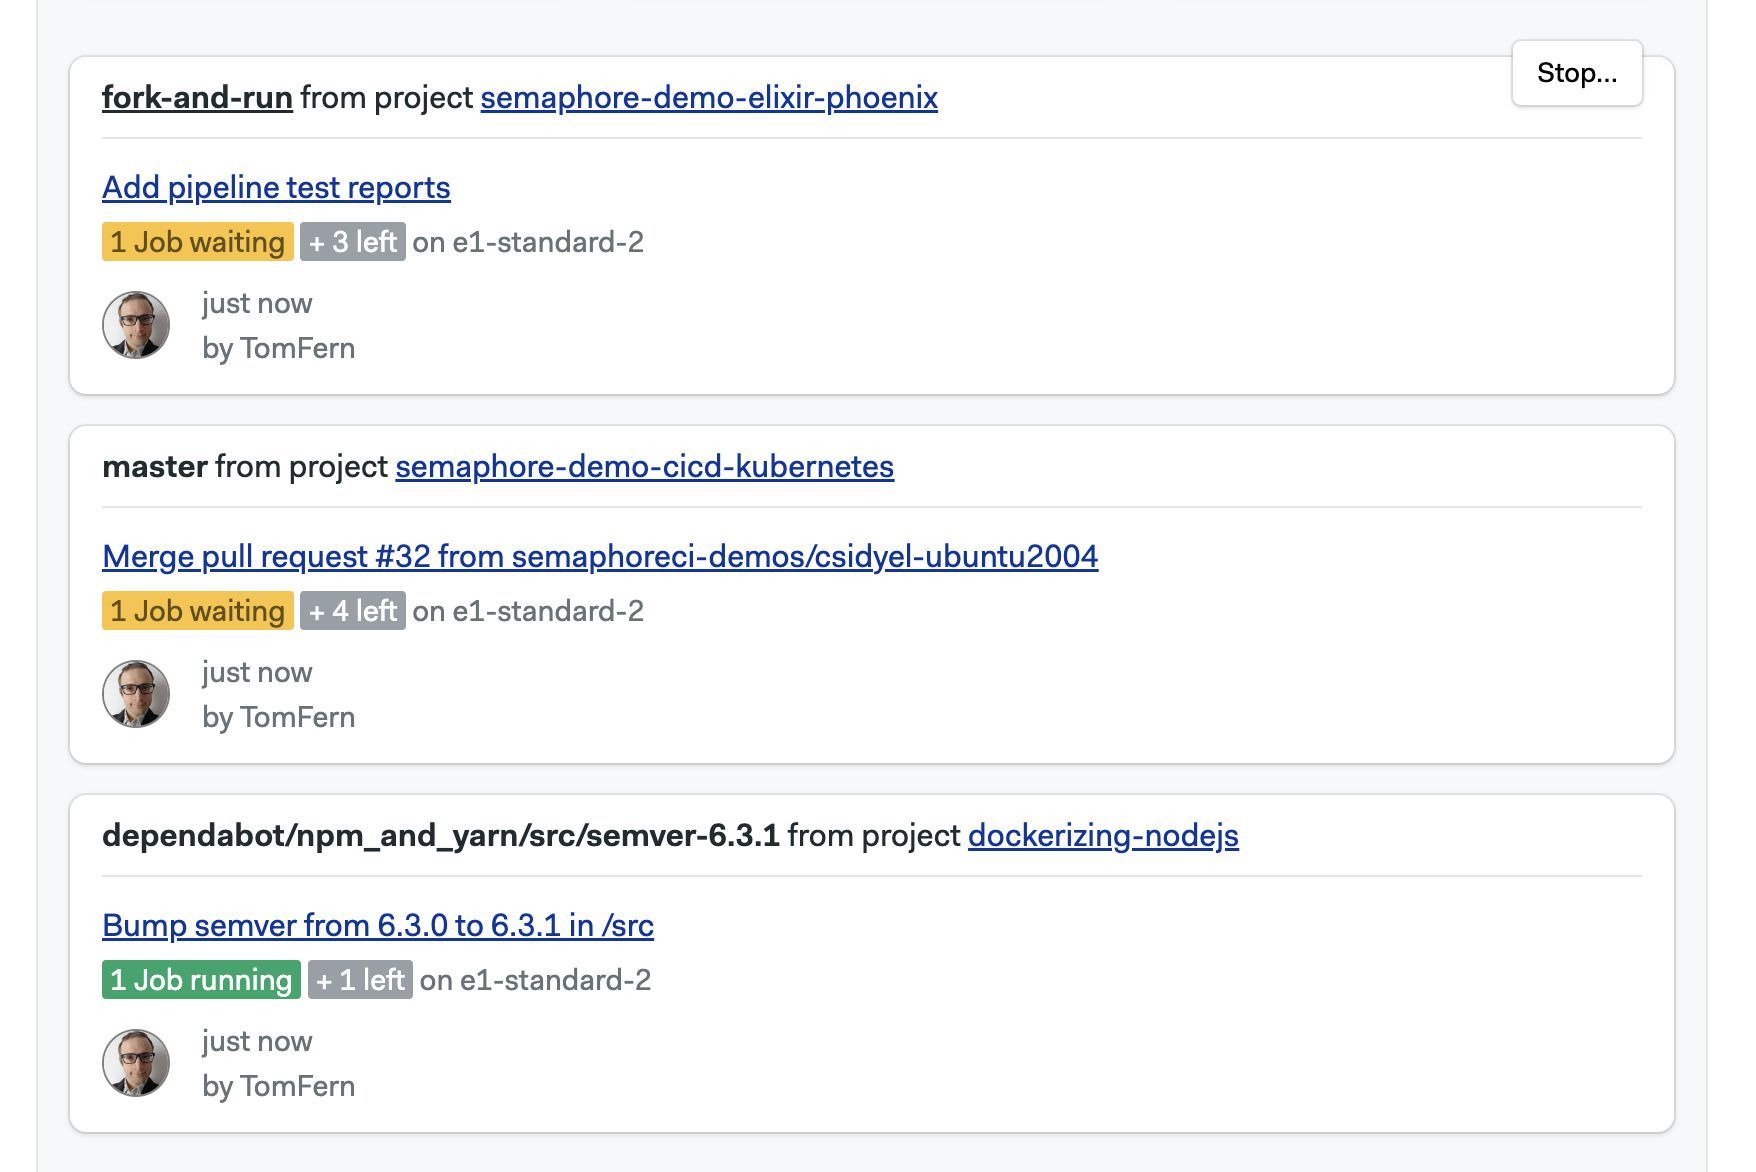
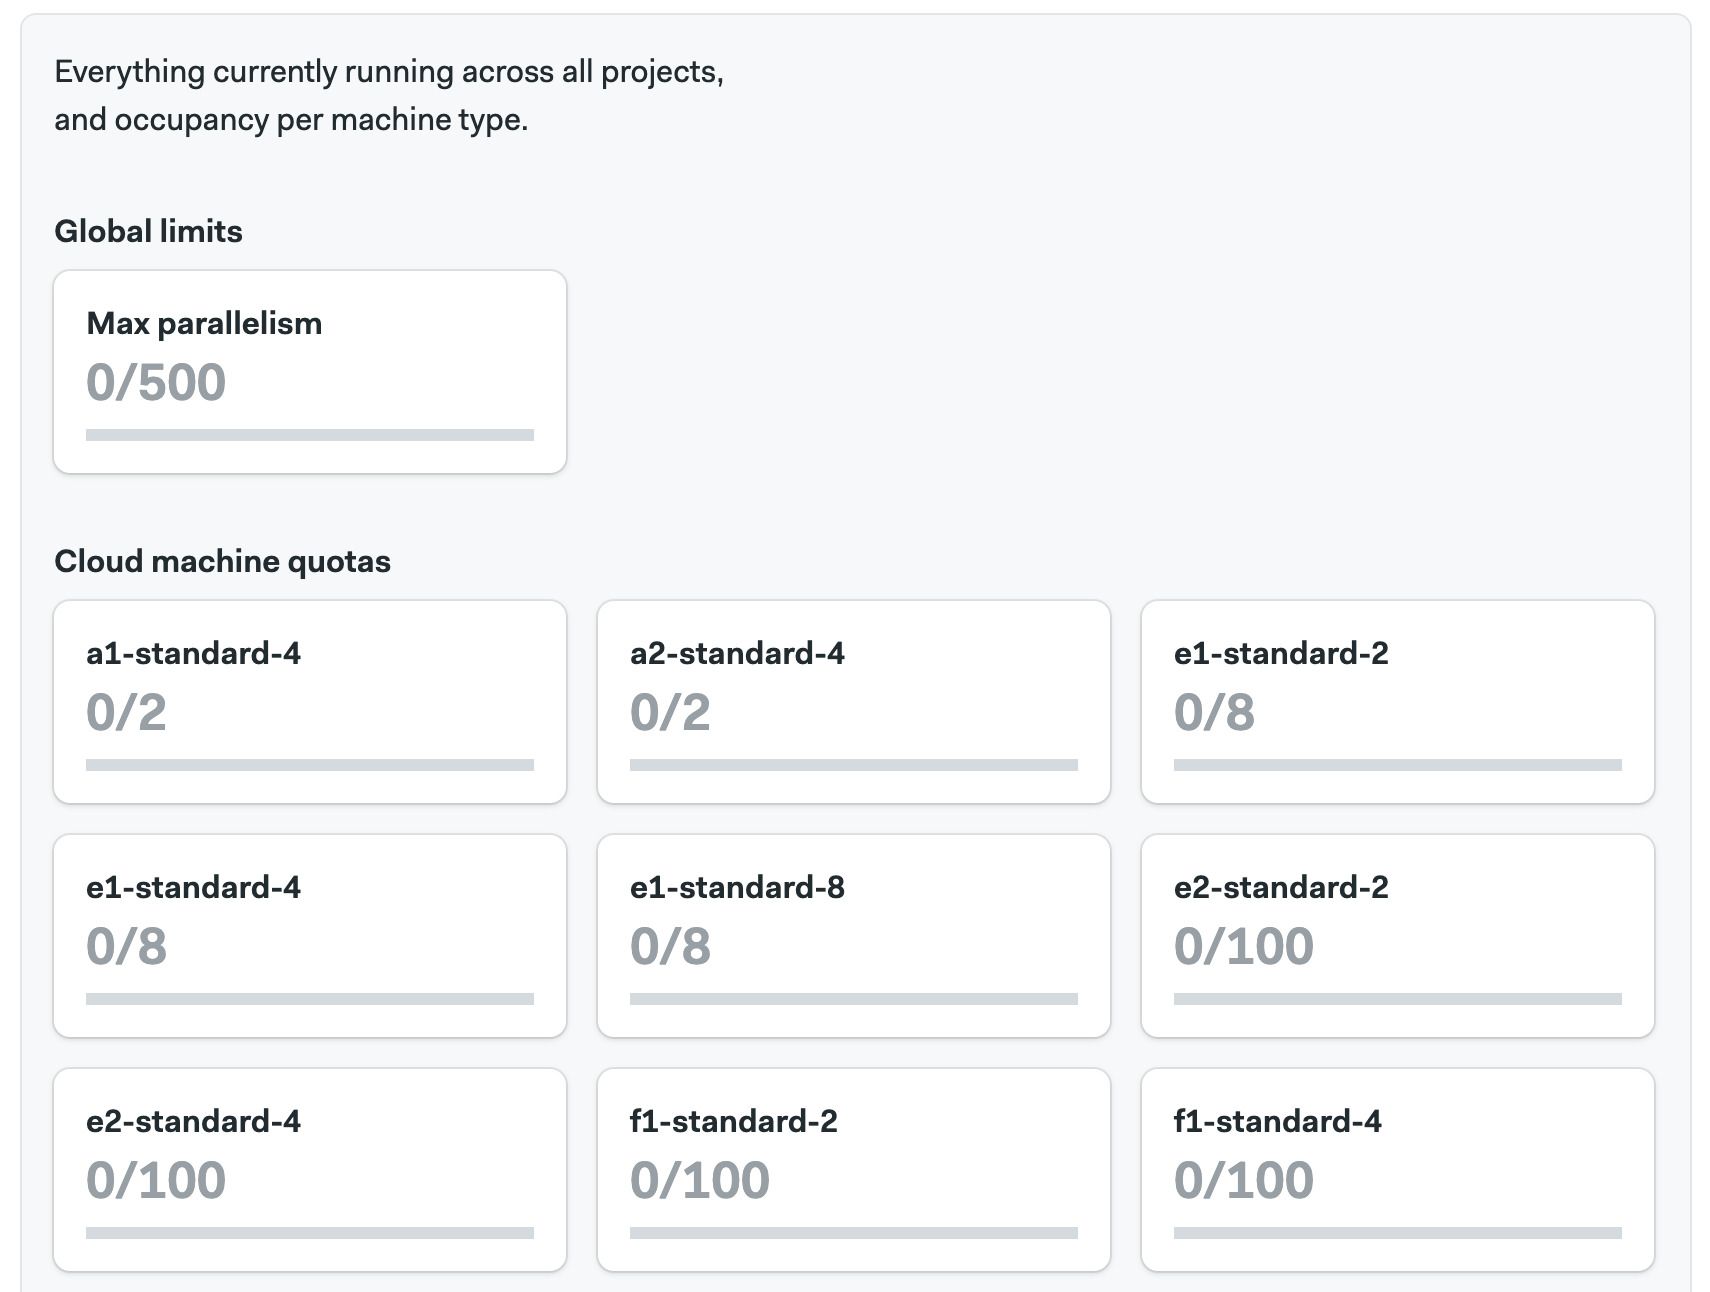
Activity monitor
The activity monitor show the agent utilization and the currently running pipelines.
To view the activity monitor, open your server menu and select Activity Monitor.
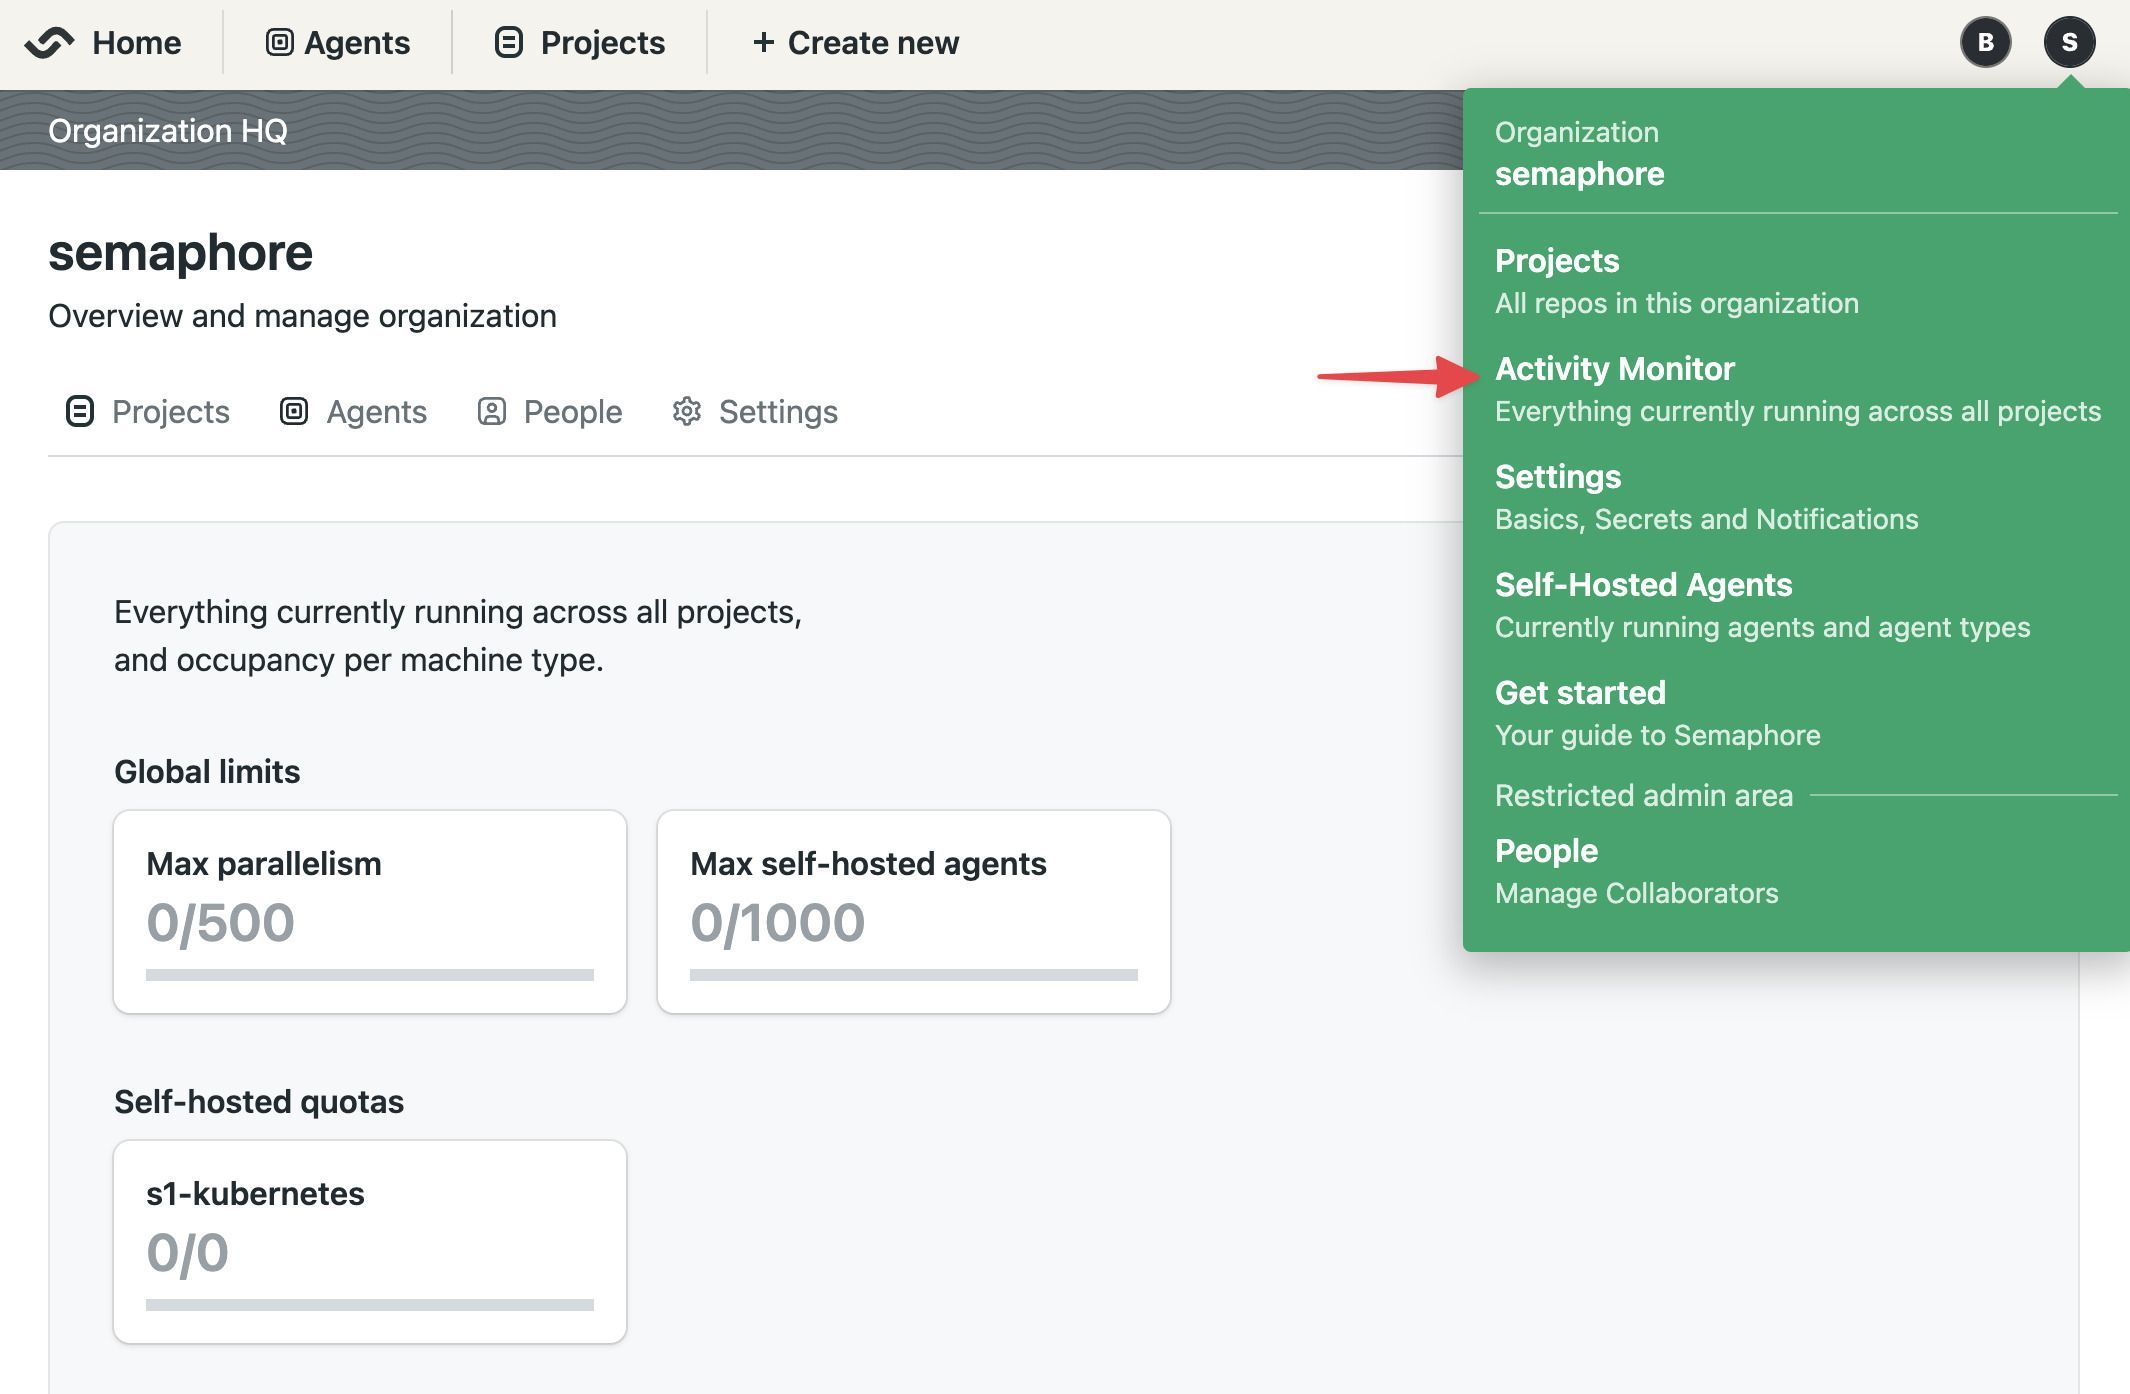
In the activity monitor, you can see the machine quota utilization for your instance. Here, you can have an overview on how Semaphore Cloud machines and self-hosted agents are being used.
In the lower part of the activity monitor you can find the currently running workflows for all the projects in your instance. Use this to know what jobs are running, and see which ones are waiting in the queue to debug usage issues.